8i | 9i | 10g | 11g | 12c | 13c | 18c | 19c | 21c | 23c | Misc | PL/SQL | SQL | RAC | WebLogic | Linux
Instrumenting Your PL/SQL Code
Introduction
I’m always telling people to instrument their code. Invariably they don’t. Then this happens:
- Dev: Why is this call failing?
- Me: What are the parameter values you are calling it with in your code?
- Dev: Values X, Y and Z.
- Me: Have you called the routine directly with those values?
- Dev: Yes, and it worked fine.
- Me: That would suggest those are not the values you are really using then.
- Dev: But they are.
- Me: How do you know. Have to traced the variable values before you made the call.
- Dev: No, but they are the correct values.
- Me: Can you put in some trace messages to check?
- Dev: (walks away) ... grumble ... grumble ... stupid trace ... wasting my time ...
- Me: (some time later) So what values were you passing in?
- Dev: One of the values was not what I was expecting, which is why it broke.
No matter who you are or how cool you think you are at programming, you can never know exactly what is going on in your code unless you instrument it.
In its most basic form, instrumentation is just trace messages in your code, allowing you to answer the "What? Where? When? Why?" in any situation. A few points to remember about instrumentation include the following.
- The information is the important part, not the implementation. In this article I will discuss some instrumentation methods I like to use, but they are not the only options.
- The method and volume of your instrumentation can evolve over time.
- If you ever hit a situation where you can’t tell what is going on, it means you need more trace.
- Some notable people suggest 50% of your code should be trace.
- Instrumentation needs an ON/OFF switch.
- What about the overhead? Even calling a procedure that does nothing has an overhead, so adding in calls to tracing routines must slow things down somewhat, right? Strictly speaking this is true, but consider life without instrumentation. You would have no V$ views or SQL Trace etc. Good commercial software makes extensive use of tracing to help make the software easier to support. Your code needs this attention to detail too. To quote Tom Kyte, "It's only an overhead if it is unnecessary!"
DBMS_APPLICATION_INFO
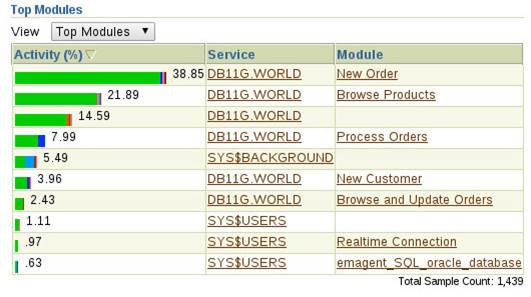
The DBMS_APPLICATION_INFO package allows programs to add information to the V$SESSION and V$SESSION_LONGOPS views. This is important because this information is visible to a number of performance tools, including Enterprise Manager. The following image shows database activity by module for a Swingbench Order Entry workload.
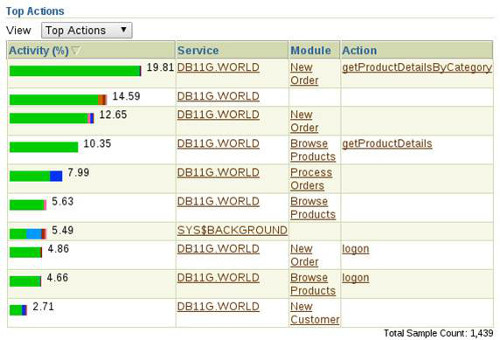
The same database activity by action is shown below.
This makes identifying code that has performance problems much simpler.
The DBMS_MONITOR package can initiate SQL trace on sessions based on their SERVICE_NAME, MODULE and ACTION settings. This information is also included in the audit trail.
You can read more about how to use DBMS_APPLICATION_INFO here.
DBMS_SESSION
Many applications manage user access internally and log into the database using a single database user. This makes identifying which "real" user is performing which task very difficult. The DBMS_SESSION package allows you to set the CLIENT_IDENTIFIER column of the V$SESSION view, giving you back the ability to identify real users.
The DBMS_MONITOR package can initiate SQL trace on sessions based on their CLIENT_IDENTIFIER settings. The CLIENT_IDENTIFIER is also included in the audit trail.
You can read more about how to use DBMS_SESSION here.
DBMS_SYSTEM
The DBMS_SYSTEM package is an undocumented and unsupported package that allows you to write to Oracle trace files or the Oracle alert log.
You can read more about how to use DBMS_SYSTEM here.
Adding Trace Messages to Code
The DBMS_OUTPUT package is probably the most common way to produce trace from PL/SQL, but it does have some issues:
- Prior to 10g, the maximum size of a line is 255 characters.
- Prior to 10g, the maximum amount of trace is limited to 1 million lines.
- The output is displayed in SQL*Plus after execution is complete.
- It is not suitable for tracing background processes.
- It has limited datatype support.
- The output can not be directed to a file.
Several people have produced wrappers around the DBMS_OUTPUT package to get around these problems and add extra functionality. Mine is call DSP (dsp.pks, dps.pkb). This section includes an example of how to use the DSP package. You might also want to take a look at log4plsql and logger.
Load the DSP package into our test user.
CONN test/test

@http://oracle-base.com/dba/miscellaneous/dsp.pks
@http://oracle-base.com/dba/miscellaneous/dsp.pkb
Assuming these DSP package is loaded, the follow code shows how it might be used in a PL/SQL package. Essentially, it would be called in a similar way to use the DBMS_OUTPUT package.
CREATE OR REPLACE PACKAGE test_dsp AS

PROCEDURE proc_1 (p_id    IN  NUMBER,
                  p_type  IN  VARCHAR2);

PROCEDURE proc_2 (p_id    IN  NUMBER);

PROCEDURE proc_3 (p_id    IN  NUMBER);

END test_dsp;
/
SHOW ERRORS


CREATE OR REPLACE PACKAGE BODY test_dsp AS

-- ------------------------------------------------------------------
PROCEDURE proc_1 (p_id    IN  NUMBER,
                  p_type  IN  VARCHAR2) AS
-- ------------------------------------------------------------------
BEGIN
  DSP.line('--------------------------------------------');
  DSP.line('test_dsp.proc_1', 'Started - p_id=' || p_id || ' p_type=' || p_type);

  IF p_type = 'BIG' THEN
    proc_2(p_id => p_id);
  ELSE
    proc_3(p_id => p_id);
  END IF;

  DSP.line('test_dsp.proc_1', 'Finished - p_id=' || p_id || ' p_type=' || p_type);
EXCEPTION
  WHEN OTHERS THEN
    DSP.line('test_dsp.proc_1', 'Finished - p_id=' || p_id || ' p_type=' || p_type ||
                                ' - OTHERS - ' || SQLERRM || CHR(10) ||
                                DBMS_UTILITY.format_error_backtrace
);
END proc_1;
-- ------------------------------------------------------------------


-- ------------------------------------------------------------------
PROCEDURE proc_2 (p_id    IN  NUMBER) AS
-- ------------------------------------------------------------------
BEGIN
  DSP.line('test_dsp.proc_2', 'Started - p_id=' || p_id);

  -- Raise an error.
  RAISE TOO_MANY_ROWS;

  DSP.line('test_dsp.proc_2', 'Finished - p_id=' || p_id);
END proc_2;
-- ------------------------------------------------------------------


-- ------------------------------------------------------------------
PROCEDURE proc_3 (p_id    IN  NUMBER) AS
-- ------------------------------------------------------------------
BEGIN
  DSP.line('test_dsp.proc_3', 'Started - p_id=' || p_id);

  -- Do something.
  NULL;

  DSP.line('test_dsp.proc_3', 'Finished - p_id=' || p_id);
END proc_3;
-- ------------------------------------------------------------------

END test_dsp;
/
SHOW ERRORS
Now let's see how we could turn on the trace information and direct it to a file. We need to create a directory object to write the trace file to, making sure the directory object is accessible by the test user.
CONN / AS SYSDBA
CREATE OR REPLACE DIRECTORY trace_dir AS '/tmp/';
--CREATE OR REPLACE DIRECTORY trace_dir AS 'c:\temp\';
GRANT READ, WRITE ON DIRECTORY trace_dir TO test;
Log in as the test user and turn on the trace.
CONN test/test

BEGIN
  -- Turn on the trace.
  DSP.show_output_on;

  -- Redirect it to a file.
  DSP.file_output_on('TRACE_DIR', 'dsp.log');

  -- Prefix the messages with a timestamp.
  DSP.show_date_on;

  -- Delete the output file if it already exists.
  BEGIN
    DSP.delete_file('TRACE_DIR', 'dsp.log');
  EXCEPTION
    WHEN OTHERS THEN
      NULL;
  END;
END;
/
We can now run the test package, containing the trace calls, with some different parameters.
BEGIN
  test_dsp.proc_1(p_id => 1234, p_type => 'BIG');
  test_dsp.proc_1(p_id => 1234, p_type => 'SMALL');
END;
/
You can look at the contents of the trace file on the OS, or using the pipelined table function in the DSP package.
SET PAGESIZE 0
SELECT * FROM TABLE(DSP.file_contents('TRACE_DIR', 'dsp.log'));

25-APR-2014 11:07:21.922000000 : --------------------------------------------
25-APR-2014 11:07:21.924000000 : test_dsp.proc_1 : Started - p_id=1234 p_type=BIG

25-APR-2014 11:07:21.925000000 : test_dsp.proc_2 : Started - p_id=1234
25-APR-2014 11:07:21.925000000 : test_dsp.proc_1 : Finished - p_id=1234 p_type=BIG -
  OTHERS - ORA-01422: exact fetch returns more than requested number of rows

ORA-06512: at "TEST.TEST_DSP", line 35
ORA-06512: at "TEST.TEST_DSP", line 12

25-APR-2014 11:07:21.926000000 : --------------------------------------------
25-APR-2014 11:07:21.927000000 : test_dsp.proc_1 : Started - p_id=1234 p_type=SMALL

25-APR-2014 11:07:21.927000000 : test_dsp.proc_3 : Started - p_id=1234
25-APR-2014 11:07:21.928000000 : test_dsp.proc_3 : Finished - p_id=1234
25-APR-2014 11:07:21.928000000 : test_dsp.proc_1 : Finished - p_id=1234 p_type=SMALL


12 rows selected.

SQL>
At a minimum you should trace:
- All entry points into your code, including the parameter values that were passed.
- All exit points from your code, including the parameter values that were passed during the initial call.
- Any major decision points in the code.
- Any significant changes to data in the code.
You can see how the "50% of your code should be trace" idea is a real possibility.
Baselines
Developers and DBAs are often asked questions like these.
- Is the application a little slower since the last release went into production?
- The application seems slower today, is something going on?
It is impossible to have a good answer to these questions unless you have some baselines to compare the current performance against.
A baseline is a measurement of performance for a specific process under a specific circumstance at a specific point in time. The list of possible metrics is virtually limitless (elapsed time, rows processed per unit time, memory, CPU and I/O used etc.).
Gathering this information on a number of systems in varying workloads allows you to do the following.
- Compare performance between environments (dev, test, prod).
- Predict the likely impact of changes in different environments.
- Perform trend analysis by comparing baselines over time.
It’s up to you to determine what represents a reasonable baseline for any particular process. Your approach and the metric you gather can evolve over time. The important thing to remember is, without something to compare against, a comparison is impossible. Some of the instrumentation discussed above may be used as part of your process of gathering and comparing baselines.
For more information see:
- DBMS_APPLICATION_INFO : For Code Instrumentation
- DBMS_SESSION : Managing Sessions From a Connection Pool in Oracle Databases
- DBMS_SYSTEM
Hope this helps. Regards Tim...